[boc_message type="e.g. information"]FREE BONUS: Download the text-to-give essential guide to learn everything you need to know about mobile fundraising![/boc_message]
 Text-to-Give Statistics
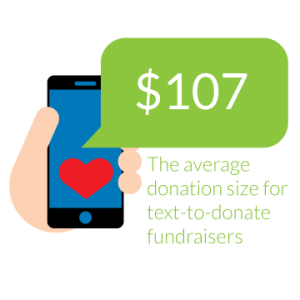 99% of text messages are opened and read within the first five minutes after they’re sent.
- The average donation size for text-to-donate fundraisers is $107.
- 91% of American adults own a smartphone.
- 41% of people still have a landline.
- Over $43 million was raised by the Red Cross’s Haiti earthquake relief text-to-give campaign.
- Text donors are mostly likely to be between 49 and 59 years old, female, married, and college graduates.
- More than 50% of the Text-to-Haiti donors made their donations shortly after learning about the campaign.
- An additional 23% donated on the same day that they heard about it.
- More than half of the Haiti donors surveyed have made text message contributions to other disaster relief efforts since their Haiti donation.
[boc_message type=”e.g. information”]FREE BONUS: Download our text-to-give guide as a PDF to learn more about mobile fundraising.[/boc_message]
 Mobile Donation Pledge Stats
 The average mobile donation pledge for fundraising events is $167.
- 84% of event fundraising pledges are fulfilled.
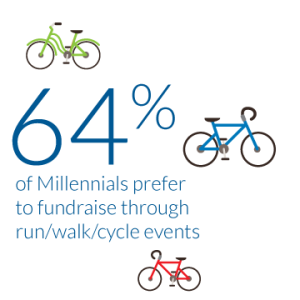
- 64% of Millennials prefer to fundraise through run/walk/cycle events.
- The highest pledge for an event last year was $109,590 (223 pledges)
- The average event pledges were $12,281 the same year.
- The largest single donation pledged was $10,000.
- The largest fulfilled mobile donation pledge to-date was $20,000.
- 51% of mobile pledges came from call centers.
- 49% came from text links.
 Mobile Fundraising Statistics
 In the last year, the percentage of smartphone owners making mobile payments grew by 36%.
- 39% of smartphone owners indicated that they had used their phones to pay at least one bill in the past month, which equates to 53 million adult individuals.
- 79% of people said that they would increase their usage of mobile payments if discounts or coupons were offered.
- 1 in 4 donors use mobile devices to discover nonprofits they were previously unaware of.
- 25% of donors complete their donations on mobile devices.
- 44% of millennials said that would rather use their mobile phones than use cash to pay for small items.
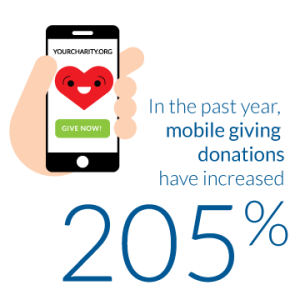
- In the past year, mobile giving donations have increased 205%.
- 51% of people who visit a nonprofit’s website do so on a mobile device.
- Overall giving increased 4% last year.
- Faith-based organizations saw the greatest increase in giving with an 18.1% increase in online donations.
- By the end of last year, 1.4 billion people worldwide donated money to nonprofit organizations.
- 64% of mobile donations come from women.
- Nearly three-fourths of the entire population of the United States donates to charity in some form or another on a regular basis (69%).
- By incorporating mobile-responsive design to their websites, nonprofits can increase their donations by 126% on average.
- An express checkout option on a website can increase mobile sales and donations by up to 55%.
- 30% of all annual giving occurs in December, and 10% of that happens within the last three days of the year.
- On December 31st, online giving is concentrated between 12 PM and 7 PM.
- Custom-branded donation pages on a nonprofit’s website help raise up to 6 times as much money on average.
[boc_message type=”e.g. information”]FREE BONUS: Download our text-to-give guide as a PDF to learn more about mobile fundraising.[/boc_message]
 Social Media Fundraising Statistics
 Nonprofits share an average of 1.2 Facebook updates and upwards of 5.3 Twitter updates per day.
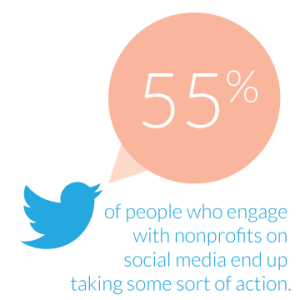
- 55% of people who engage with nonprofits on social media end up taking some sort of action.
- 59% of those people donate money.
- 53% volunteer.
- 52% donate clothing, food, or other personal items.
- 43% attend or participate in charitable events in their community because of social media.
- 40% subsequently purchase a product that benefits that charity.
- 25% contact their political representatives either by phone, letter, or email after engaging with a cause on social media.
- 15% organize their own events in their community afterward.
- More than 29% of mobile donation traffic on Giving Tuesday came from Facebook.
- 30% of nonprofits use Instagram to raise money and awareness.
- 29% of nonprofits have Pinterest.
- 28% of nonprofits are on Youtube.
- 27% are of nonprofits have LinkedIn pages.
- 24% of nonprofits also have Google+ accounts.
- For every 1,000 email subscribers, nonprofits have an average of 199 Facebook followers, 110 Twitter followers, and 13 mobile subscribers.
- Nonprofits have claimed Facebook as the most important social media for their causes, with Twitter in a close second place, and YouTube in third place.
 Email Fundraising Statistics
 Direct mail fundraising is 245 times more expensive than email.
- For every 1,000 fundraising emails a nonprofit sends, it will raise an average of $17.
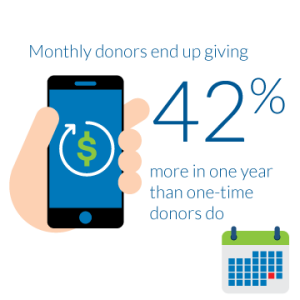
- Monthly donors end up giving 42% more in one year than one-time donors do.
- Walk/run/cycling event fundraisers who send more than 15 emails raise 76% more than non-email senders.
- Email results in 1/3 of online fundraising revenue.
- 13% of emails are opened and read within five minutes.
- Emails with social sharing options increase click-through rates by 158%.
- 79% of fundraising emails do not personalize their “To” line with a first and last name.
- 17% of people who send their support from email are doing so on a mobile device.
- The open rate for nonprofit emails specifically is between 15% and 18% on average.
- 27% of nonprofits spend less than $1,000 of their budget on marketing a year.
 Crowdfunding Statistics
 $9,237.55 is the average amount a nonprofit crowdfunding campaign raises.
- $568 is the average amount individuals raise through crowdfunding.
- An average of 8 people donate to an individual crowdfunding campaign.
- The average donation size to a crowdfunding campaign is $66.
- An average crowdfunding campaign lasts around 9 weeks.
- Campaigns that reach 30% of their crowdfunding goal within the first week are substantially more likely to reach 100% of their goal by the end.
- 17% of crowdfunding donations are made on mobile devices.
- For every increase in Facebook friends (10, 100, 1000), the probability of a crowdfunding campaign’s success increases drastically (from 9% to 20%, to 40%, respectively). The more Facebook friends a nonprofit has, the more likely that nonprofit’s crowdfunding page will be to be funded.
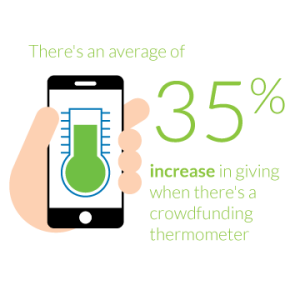
- There’s an average of a 35% increase in giving when there’s a crowdfunding thermometer.
- 62% of donors who give to crowdfunding campaigns are new to crowdfunding
Clearly the mobile fundraising space is diverse and offers a lot of room for success. Get started planning your nonprofit’s next mobile fundraising campaign by studying up with some additional resources:
- Fundraising Pledges vs. Donations | What’s the Difference? Pledge campaigns are a great way to rally support fast, but how are they different from traditional donation campaigns?
- 11 Best Online Donation Tools and Software by Re:Charity. There’s a wide variety of options out there for nonprofits looking to try new digital and mobile strategies!
- How to Collect Pledges: 6 Steps for Securing Pledged Support. Collecting the funds your supporters pledged to you can be tricky, but it’s an essential part of campaigning.
Sources: